In this module you will learn how to use the Attribute Slicer Power BI Custom Visual. Using the Attribute Slicer you have the ability to filter your entire report while also being able to visibly see a measure value associated with each attribute.
Module 44 – Attribute Slicer
Downloads
- Power BI Custom Visual – Attribute Slicer
- Dataset – Word Frequency.xlsx
- Completed Example – Module 44 – Attribute Slicer.pbix
Key Takeaways
- Lets you filter a dataset on a selected set of values.
- Selecting these values places them in the applied filters list.
- The Attribute Slicer can be viewed either vertically or horizontally.

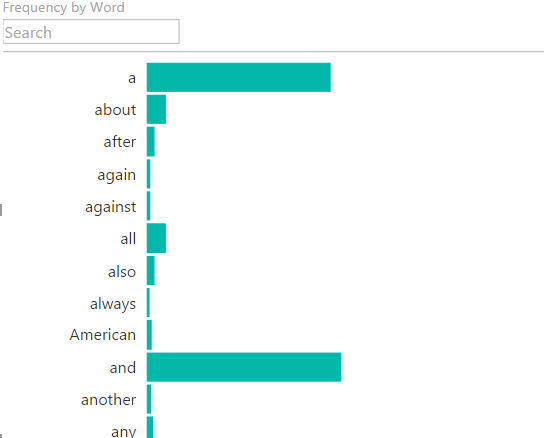
This Attribute Slicer displays the frequency that certain words are used in the English language.
- Under the Format paintbrush there are several customizations available for the Attribute Slicer.
- Using the General section you can adjust the text size or turn on/off the option section at the top of the Attribute Slicer. Turning this off means you will no longer be able to search for values or see the applied filter values.

- In the Display section you can change how much space the bars on the chart are taking up. You can also change the orientation of the visual to be vertical (default) or horizontal here.

- The Selection section allows you to do things like make the slicer only able to accept a single value section instead of the default of multi-select. You can also turn on Brush Mode, which allows you to drag and select multiple values at once on the slicer. Finally the Use Token option allows you to turn off just the applied filter section of the visual.

In addition to these properties you have a set of settings that appears on every visual to adjust the background color, add a border around the visual and lock the aspect ratio.
Find Out More
You will always be able to find this video module and advanced viewing of future modules on the Pragmatic Works On Demand Training platform. Click here to learn more about this training platform that includes 30+ courses.
Catch up on all the Power BI Custom Visuals blog posts here

Hi,
I have one question about the table that is being showed. How is it made non interactive? It does not allow to select values by clicking.
Thank You
Kamal
It is interactive in this video. Are you asking how to turn that off? If so there’s an option under Format ribbon called Edit Interactions that can make something non-interactive.
Hi,
Thank you for the reply.
I am asking about how you made the table non-responsive if you click on it.
I downloaded the pbix file and if I click on the table(not the attribute slicer which is filtering the table) it will not highlight any row like we know that if we click on any value in the table or matrix it will get highlighted and will filter rest of the visuals on the page.
And even if I the select the table and got to format and select edit interactions it is not showing the filter options for the slicer visual( and rest of the visuals on the page) which we get if we select any other filter visual.
And also on clicking the ellipsis button it is not showing sorting features.
Thank You!
Kamal