![Stream Graph_thumb[4]](https://devinknightsql.com/wp-content/uploads/2016/09/stream-graph_thumb4.png "Stream Graph_thumb[4]")
In this module you will learn how to use the Stream Graph chart Power BI Custom Visual. The Stream Graph is similar to a Stacked Area Chart but has more of a fluid look and feel to it. You’ll find this visual often useful when displaying data across time.
Module 18 – Stream Graph
Downloads
- Power BI Custom Visual – Stream Graph
- Dataset – Language in Movies.xlsx
- Completed Example – Module 18 – Stream Graph.pbix
Key Takeaways
- Works and looks similar to a Stacked Area Chart but with a wiggle feature that gives it a more fluid look and feel
- Great for displaying data that changes over time

This shows a Stream Graph with a multiple series values, which are separated out by color.
- Under the Format paintbrush there are quite a few customizations that can be made to the appearance of the Stream Graph.
- First under the General section of the Stream Graph you will find a property called Wiggle. This property is turned on by default but turning it off makes


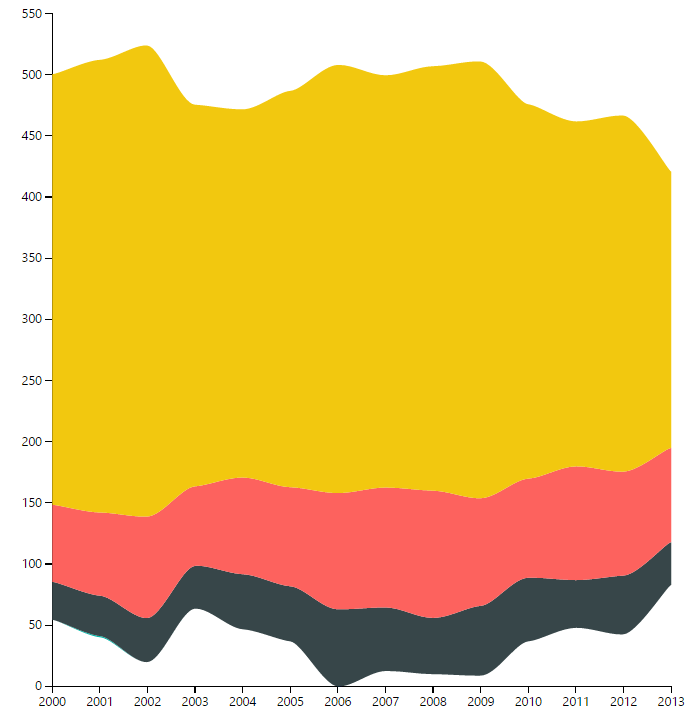
This shows the what the Stream Graph looks like with the Wiggle property turned off.
- Using the X-Axis or Y-Axis properties you can turn on or off the ability to display a title on these areas of the graph or change the color as well.


- Under the Legend section you can change the Position, Color and Text size of the legend. You are also able to add a title and customize the title text.

- Turning on the Data Labels property places a label on every data point on the graph. Once data labels are turned on you can change their color and text size. I have found that using these can sometimes be a little overwhelming.

- In addition to these properties you have a set of settings that appears on every visual to adjust the background color, add a border around the visual and lock the aspect ratio.
Find Out More
You will always be able to find this video module and advanced viewing of future modules on the Pragmatic Works On Demand Training platform. Click here to learn more about this training platform that includes 25+ courses.
Catch up on all the Power BI Custom Visuals blog posts here.
